GEOTECHNICALENGINEERING
ST. CATHARINES
HomeGeophysicsElectrical resistivity / VES (Vertical Electrical Sounding)

Electrical Resistivity Testing & VES Surveys in St. Catharines

Practical geotechnics, field-tested.

LEARN MORE

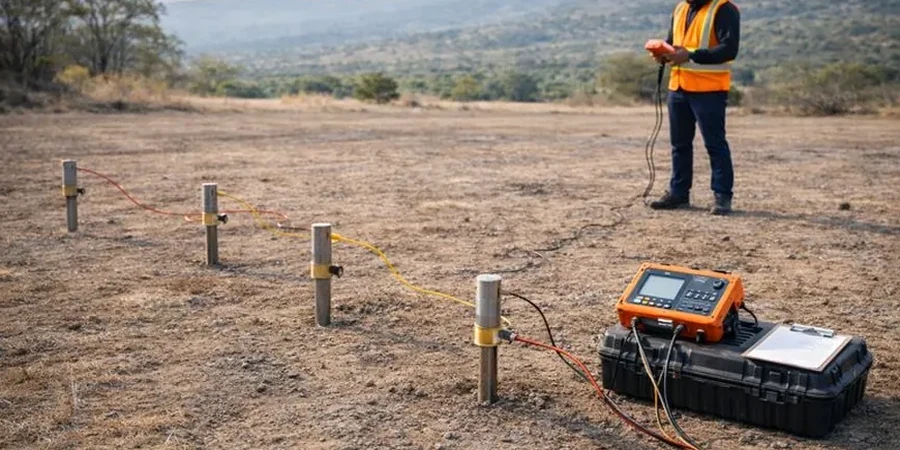
A multi-electrode resistivity array laid out across a St. Catharines site provides the clearest window into what lies beneath the surface without turning a single shovel. When we mobilize our 4-pin Wenner-Schlumberger spread across the clay plains and shale bedrock that characterize this city, we start seeing the electrical contrasts that separate dense Queenston Formation from overlying glacial till and saturated silts almost immediately. The method injects a controlled DC current into the ground and measures the resulting potential difference, building a vertical profile of apparent resistivity values that we then invert to true resistivity. For projects close to the Welland Canal or along the Niagara Escarpment, where groundwater pathways and bedrock depth vary sharply across short distances, this non-invasive technique often means the difference between a geotechnical model that catches a hazard and one that misses it completely. We combine the VES data with targeted CPT soundings when clients need direct correlation between resistivity anomalies and cone tip resistance in the dense clays common across the Garden City’s industrial corridors.

In the Niagara region, resistivity contrast between saturated Queenston shale and overlying glacial clays gives our VES soundings the signal clarity needed to map bedrock depth without excessive interpretation ambiguity.

Our service areas

Our approach and scope

St. Catharines sits on a geological patchwork that makes resistivity surveying both powerful and demanding. The surficial geology shifts from Halton Till—a stiff, low-permeability diamict—to glaciolacustrine silts and clays deposited by ancestral Lake Iroquois, with the red shales of the Queenston Formation typically appearing at depths between 5 and 18 meters depending on where you are relative to the Escarpment brow. These units carry distinct resistivity signatures: the till often reads between 20 and 60 ohm-m when moist, the lacustrine clays can drop below 10 ohm-m due to their high cation exchange capacity, and the competent shale bedrock jumps above 100 ohm-m. That contrast is what we exploit during a VES sounding. By progressively expanding the electrode spacing from 1.5 m out to 100 m or more, we build a resistivity-depth curve that reveals the transition from overburden to bedrock with a precision that auger refusal data alone cannot match. The method also detects lateral changes in pore water salinity—a practical concern near former industrial parcels along the old Welland Canal alignment where historical fill and brine migration have altered the subsurface conductivity profile in ways that standard borehole logging might overlook.
Electrical Resistivity Testing & VES Surveys in St. Catharines
Technical reference — St. Catharines

Local geotechnical context

One pattern we notice repeatedly on St. Catharines projects is the assumption that a single borehole at the corner of a lot tells the full bedrock profile. The Queenston Formation’s upper surface is rarely a flat plane—it undulates, and in some areas along the Escarpment face, it can drop 4 metres across a 30-metre building footprint. Relying on point data alone risks designing a foundation that bears on rock at one column and hangs in compressible clay at the next. When resistivity is skipped, that differential settlement potential stays hidden until excavation reveals the problem, by which point change orders and schedule delays are locked in. Another risk specific to this region involves buried metallic infrastructure: old rail spurs, abandoned utility lines, and steel-reinforced concrete remnants from demolished canal-era structures can distort resistivity readings if not identified during survey planning. Our field crew cross-references historical utility maps and runs a preliminary EM-31 reconnaissance before laying out the VES spread, so we can flag cultural noise before it contaminates the inversion model and leads to a false anomaly interpretation.

Need a geotechnical assessment?

Reply within 24h.

Email: info@geotechnicalengineering.co

Relevant standards

ASTM D6431-18 – Standard Guide for Using the Direct Current Resistivity Method for Subsurface Site Characterization, CSA A23.3-19 – Design of Concrete Structures (referenced for foundation design parameters derived from geophysical data), NBCC 2020 – National Building Code of Canada, Part 4 (structural design provisions requiring geotechnical site characterization), MTO Laboratory Testing Manual (applicable for resistivity correlation with Ontario soils)

Technical parameters

ParameterTypical value
Array configurationsWenner, Schlumberger, dipole-dipole
Typical depth of investigation1 to 120 m below grade
Electrode spacing range1.5 m to 150 m (AB/2)
Current injectionUp to 500 V DC, constant-current regulated
Apparent resistivity range0.5 to 10,000 ohm-m
Data inversion methodSmoothness-constrained least-squares (L2 norm)
Compliance referenceASTM D6431-18 (surface resistivity)

Questions and answers

How deep can a VES survey investigate in the St. Catharines area?

Practical depth of investigation depends on the maximum electrode spread we can deploy on your site. With a 150-metre AB/2 spacing—feasible on larger industrial parcels in the Glendale Avenue corridor or out toward Port Weller—we can reach depths of 100 to 120 metres. On tighter urban lots in the downtown core, where spread length is constrained by property lines and buried utilities, we typically achieve 25 to 40 metres of penetration, which is more than enough to map the overburden-bedrock contact across most of the city. The Queenston Formation shale usually appears as a sharp resistivity increase between 5 and 18 metres depth, and our inversion models resolve that interface to within roughly 10 percent of the actual depth when calibrated against at least one borehole or CPT log.

What does electrical resistivity testing cost for a typical St. Catharines project?

For a standard VES survey with two to four sounding locations and a 2D resistivity profile along one line, budgets in St. Catharines generally fall between CA$860 and CA$1,380. The final figure depends on the number of electrode deployments, total lineal metres of profiling, site accessibility, and whether we need to incorporate existing borehole data into a constrained inversion. Projects requiring extended spreads beyond 100 metres or multi-line 2D grids for mapping contaminant plumes or karst features run higher due to additional field days and processing time. We provide a fixed-price proposal after reviewing your site plan and survey objectives.

Can electrical resistivity distinguish between different types of clay in the Niagara region?

Yes, to a useful degree. The glaciolacustrine clays deposited by glacial Lake Iroquois typically read below 15 ohm-m due to their high water content and cation exchange capacity, while the stiffer Halton Till—which contains a higher percentage of silt and sand—commonly measures between 25 and 60 ohm-m. The contrast is not always sharp enough to draw a precise boundary on a single VES curve, but when we run a 2D resistivity line and calibrate the colour contour against a borehole log, the transition zone between these two units becomes interpretable. This is particularly relevant for earthworks and excavation planning, because the Lake Iroquois clays are far more sensitive to disturbance and moisture change than the overconsolidated till.

Location and service area

We serve projects in St. Catharines and surrounding areas.

View larger map